|
Graphic designers more and more often face with tasks which require expressing of data in graphic form. I don’t think that infographics is just another design trend. It is most likely that this design direction will continue growing. Today we will look at the method of area separation of the vector object in accordance with data that can be presented in absolute and percentage terms.
It is difficult to solve this task with using only standard functions of Adobe Illustrator. In such cases a special script should be created which performs the necessary calculations fast. Jaroslav Tabachkovsky (the author of the Mesh Tormentor) wrote a special script to solve this problem. You can download it by clicking on Download button in this article. Install the script objectsGrouper.jsx before you start following instructions from this article.
To install the script, extract the zip archive, copy the objectsGrouper.jsx and paste it to the folder of Adobe Illustrator with scripts, for example:
For Windows: C:\Program Files\Adobe\Adobe Illustrator CS5\Presets\en_GB\Scripts
For Mac: Applications / Adobe\Adobe Illustrator CS5\Presets\en_GB\Scripts
Now restart Adobe Illustrator (the script was tested in Adobe Illustrator CS5, CS6 and CC).
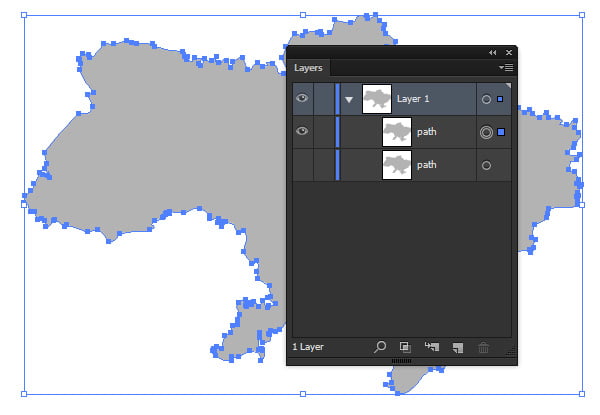
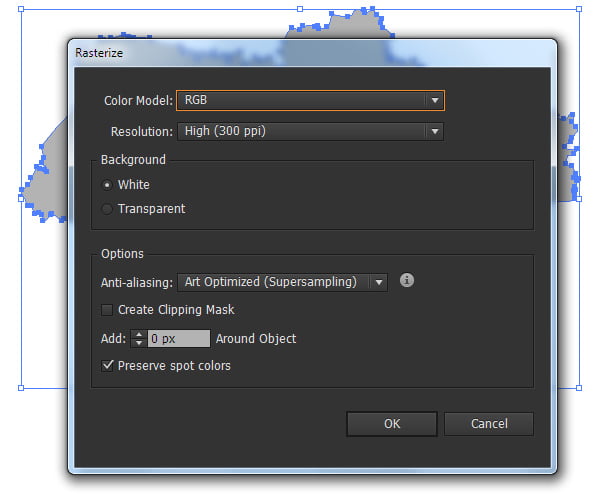
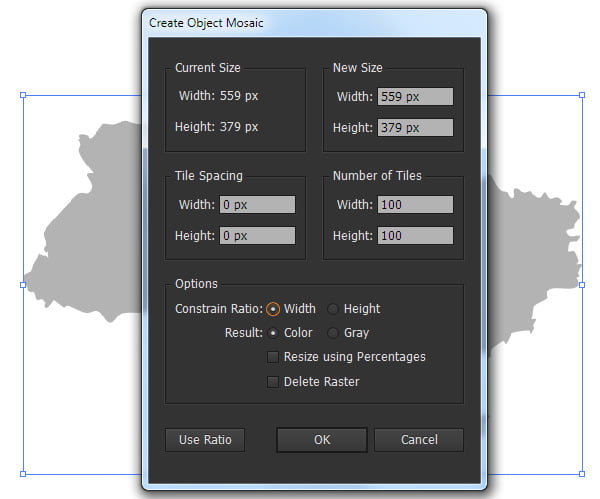
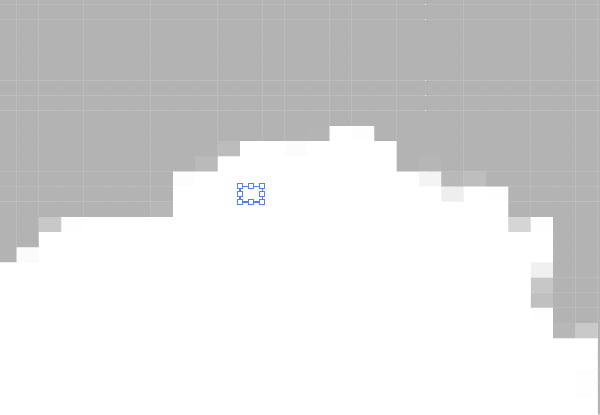
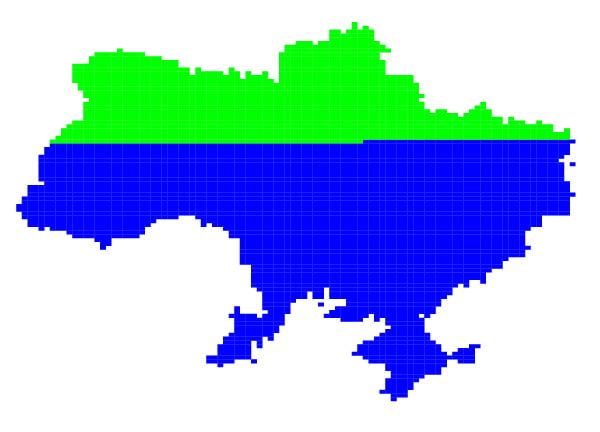
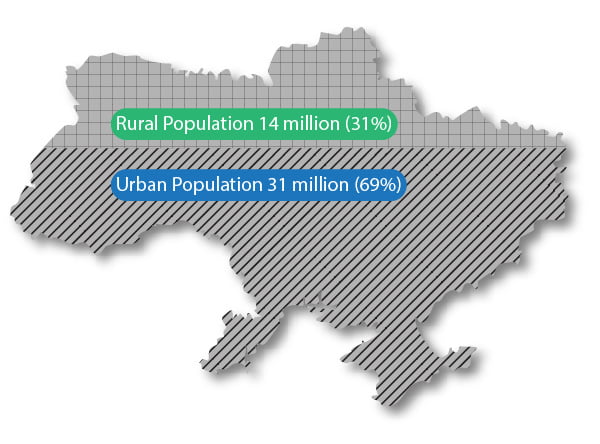
Now we can start separating the object. So, we have an object of a complex shape (the map of Ukraine). Suppose we need to split this object into parts, which correspond to the number of rural and urban population - 14 and 31 million accordingly. Double this object (Cmd/Ctrl + C; Cmd/Ctrl + F), then temporally turn off the visibility of the lower object in the Layers panel. Keep the upper object selected, go to the Object > Rasterize… In the opened dialog box leave set by default parameters unchanged, then click OK. Now go to the Object > Create Object Mosaic… and set the number of tiles into which our raster image will be split. The separation accuracy of the object depends on the number of tiles, however, it will take your computer a long time to create a mosaic if the value is high. Ungroup the received mosaic (Cmd/Ctrl + Shift + G).
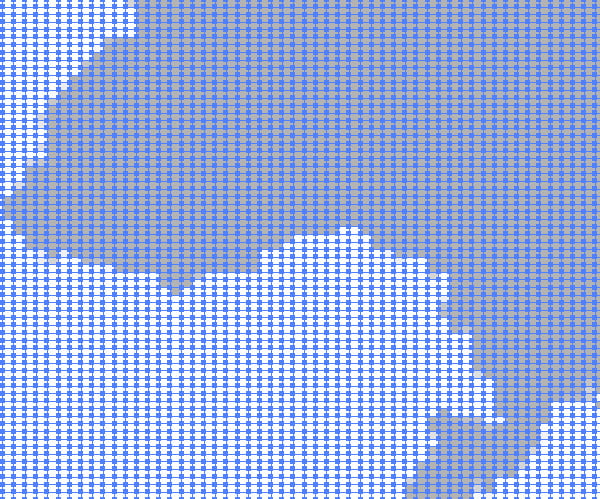
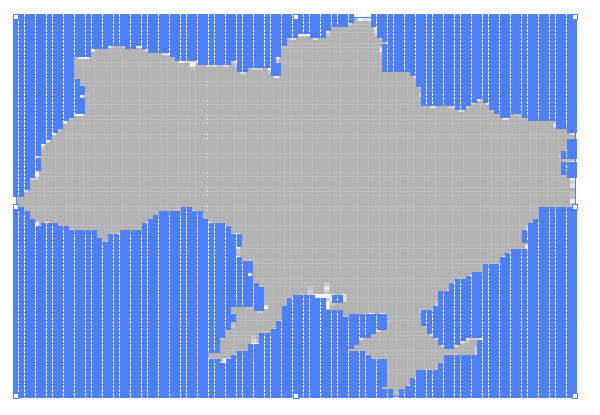
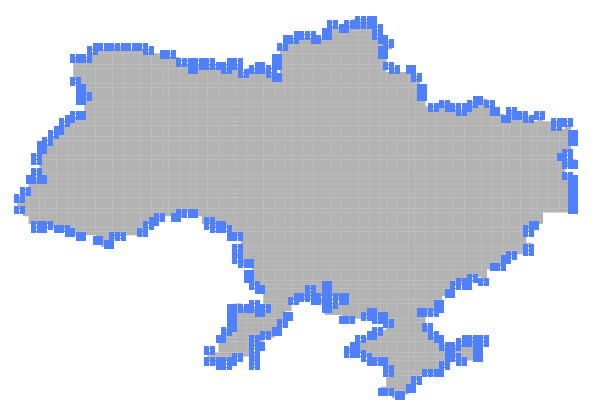
Select one of the white tiles, then go to the Select > Same > Fill Color. Click on Delete. On the edges of the map there are some tiles, the fill of which differs from the fill of the tiles inside the image. These objects can also be deleted. To do so, select any grey tiles in the center of the map, then go to the Select > Same > Fill Color and after it go to Select > Inverse. And now click on the Delete key.
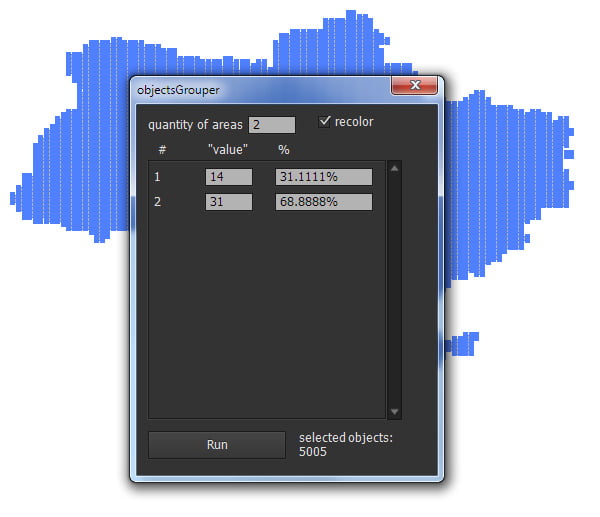
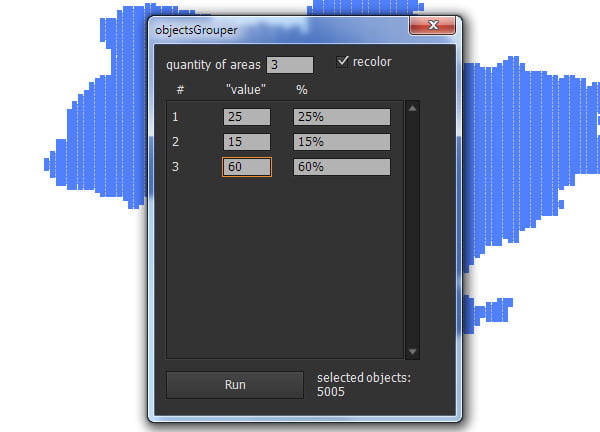
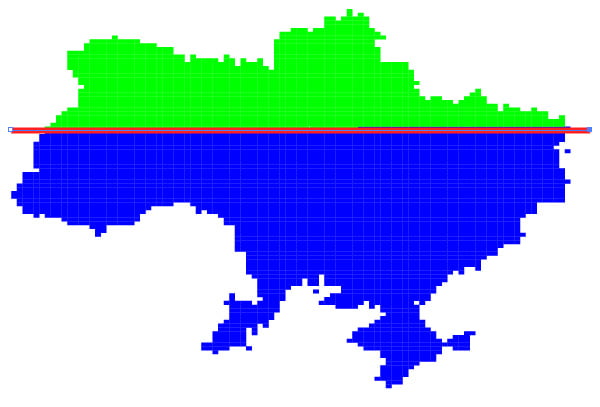
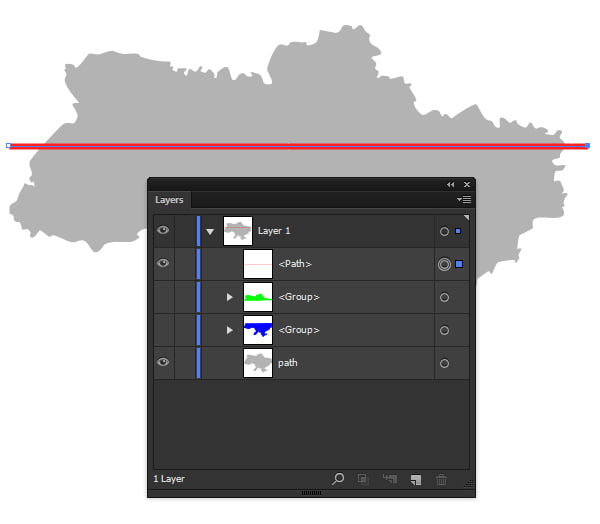
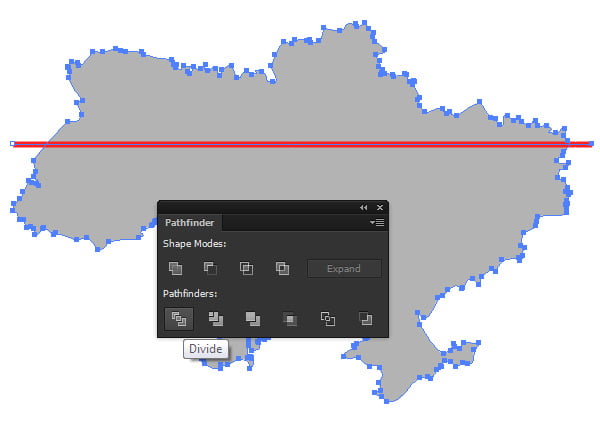
Select all the remaining tiles (Cmd/Ctrl + A), then start the script we’ve recently installed (File > Scripts > objectsGrouper). On the opened dialog box set the amount of space in the digital field "quality of areas”, tick "recolor” for clarity, then enter values into a numeric field "value”, click on the Run button. After a moment our map is divided into parts, which correspond to input data. If the data expressed as a percentage, then percentage value can be entered into the number fields "value”, but don’t forget that the sum of all fields should be 100% Now create a straight line that passes through the boundary area and beyond the contour of the map. Turn off the visibility of groups with tiles and turn on the visibility of the vector map in the Layers panel. Select the map and a horizontal line then click on the Divide in the Pathfinder panel. Now we can apply different fills to the divided space and add the necessary inscriptions.
|