|
Final Image Preview Tutorial Details - Program: Adobe Illustrator
- Difficulty:Intermediate / Advanced
- Estimated Completion Time: 2 hours
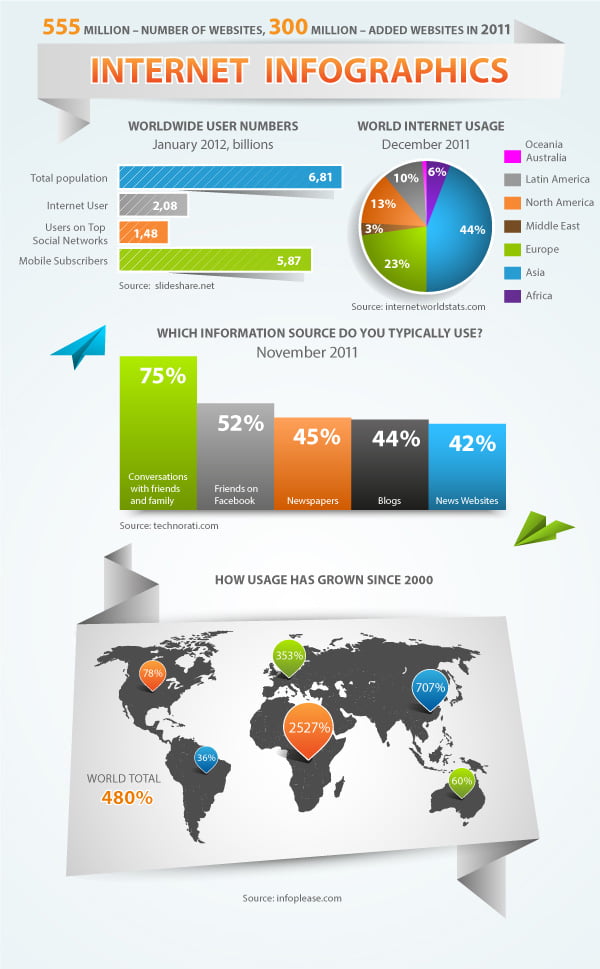
In this Adobe Illustrator tutorial we will learn how to create the information graphics (Infographics) using the standard tools of Adobe Illustrator. We will also show you some ways how to change graph appearance retaining its dynamic functions; i.e. you will be able to edit the data graphs after all transformations. Let’s begin!
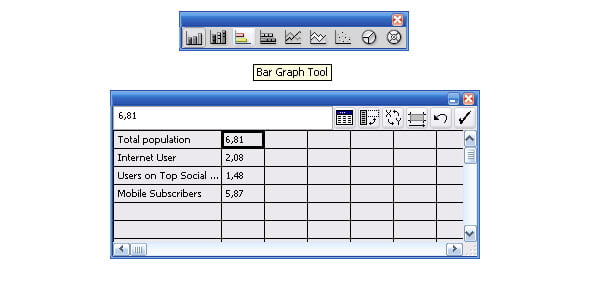
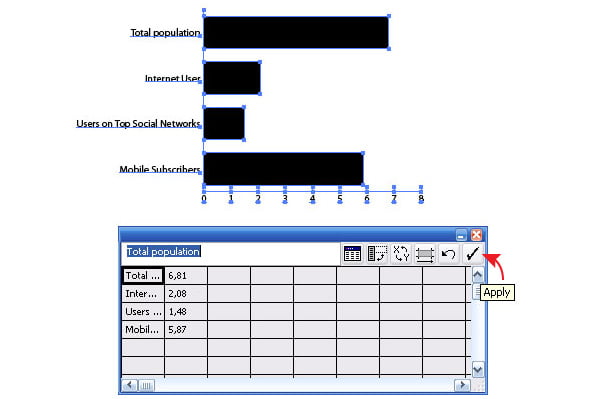
Step 1The work with infographics always involves information search and data processing in the first phase of your project. I use the internet statistics in this tutorial. The first graph, which we create, will show a number of internet users, social networks, mobile subscribers and total population (source: slideshare.net). All that I listed above is called categories, and numbers which correspond to these categories are called data. Take the Bar Graph Tool and create a marquee selection on the black area of the current document. As a result, the Graph Data window opens, where all categories and data should be entered. All information should be entered in the Entry text box. The selection of necessary cells of the table can be made with the cursor. After entering the information click on the Apply in the Graph Data window, this leads to the creation of a graph.
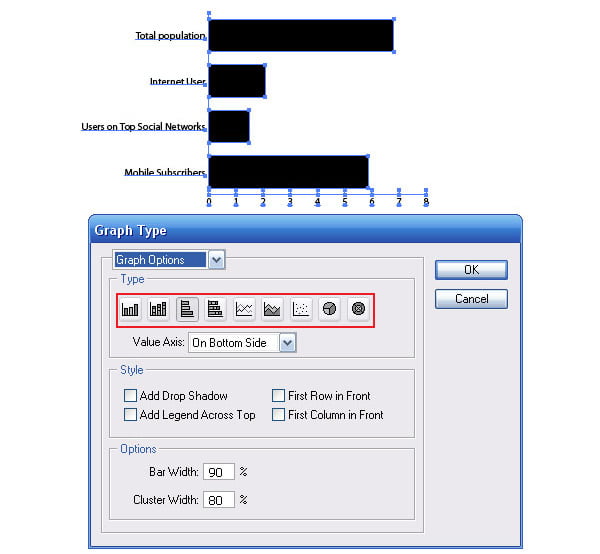
Step 2Our created object is a dynamic object, i.e. we can always change the name, data sequence and the number of categories and/or data. If you closed the Graph Data window, go to the Object > Graph > Data… where you can change your data again. We can change the type of graph after it has been already formed. To do so, go to the Object > Graph > Tape… The graph design will change only after you click on OK in the dialog box.
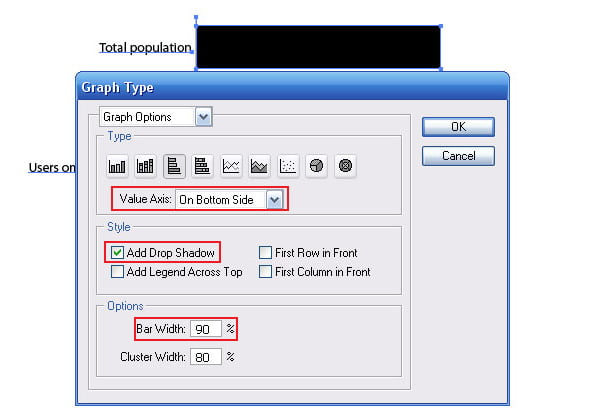
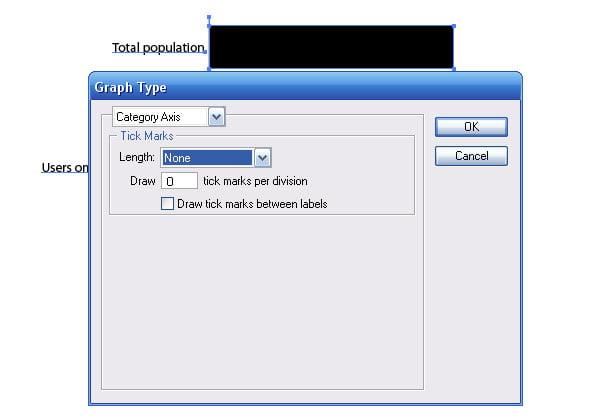
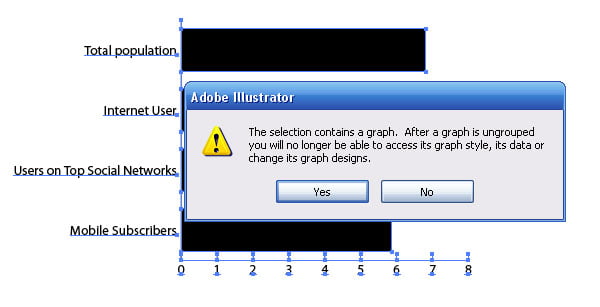
Step 3Let’s examine the Graph Type window. As you can see, we can change the width of bars, indicate the axis position and even add drop shadow! Moreover, we can edit the Value and Category axis. But as you all understand it is clearly not enough to make the right kind of graph. And here a lot of graphic designers make one and the same mistake: they convert a dynamic graph into a group of regular vector objects. It can be done by ungrouping with the Graph object (Shift + Cmd / Ctrl + G). The fact that you lose the ability of editing you data. We won’t do this mistake; we will save the dynamic functions of the graph. You will find out how to change graph’s appearance a little bit later.
You can read full version this vector tutorial on DesignModo
Follow us if you want to be the first to know about the latest Adobe Illustrator tutorials and articles. Vectorboom team works for you!
|