|
Final Image Preview In this Adobe Illustrator tutorial, we will learn how to collect and process statistical data, then visualize it using Adobe Illustrator. You will also learn how the various vector elements of this project were created, as well as how to save the project in PDF format, edit it, add hyperlinks, and place navigation between pages. This is a detailed infographic tutorial and you can follow along at the jump. Tutorial Details - Program: Adobe Illustrator and Adobe Acrobat Pro
- Difficulty: Intermediate
- Estimated Completion Time: 2-3 hours
A Primer on InfographicsInformation graphics or infographics are graphic visual representations of information, data or knowledge. These graphics present complex information quickly and clearly, such as in signs, maps, journalism, technical writing, and education. With an information graphic, computer scientists, mathematicians, and statisticians develop and communicate concepts using a single symbol to process information (Wiki).
Information presented only in numbers may look awkward and people may not be interested in it. Our task is to send the message to the audience that may consist of your customers, visitors or potential sponsors.
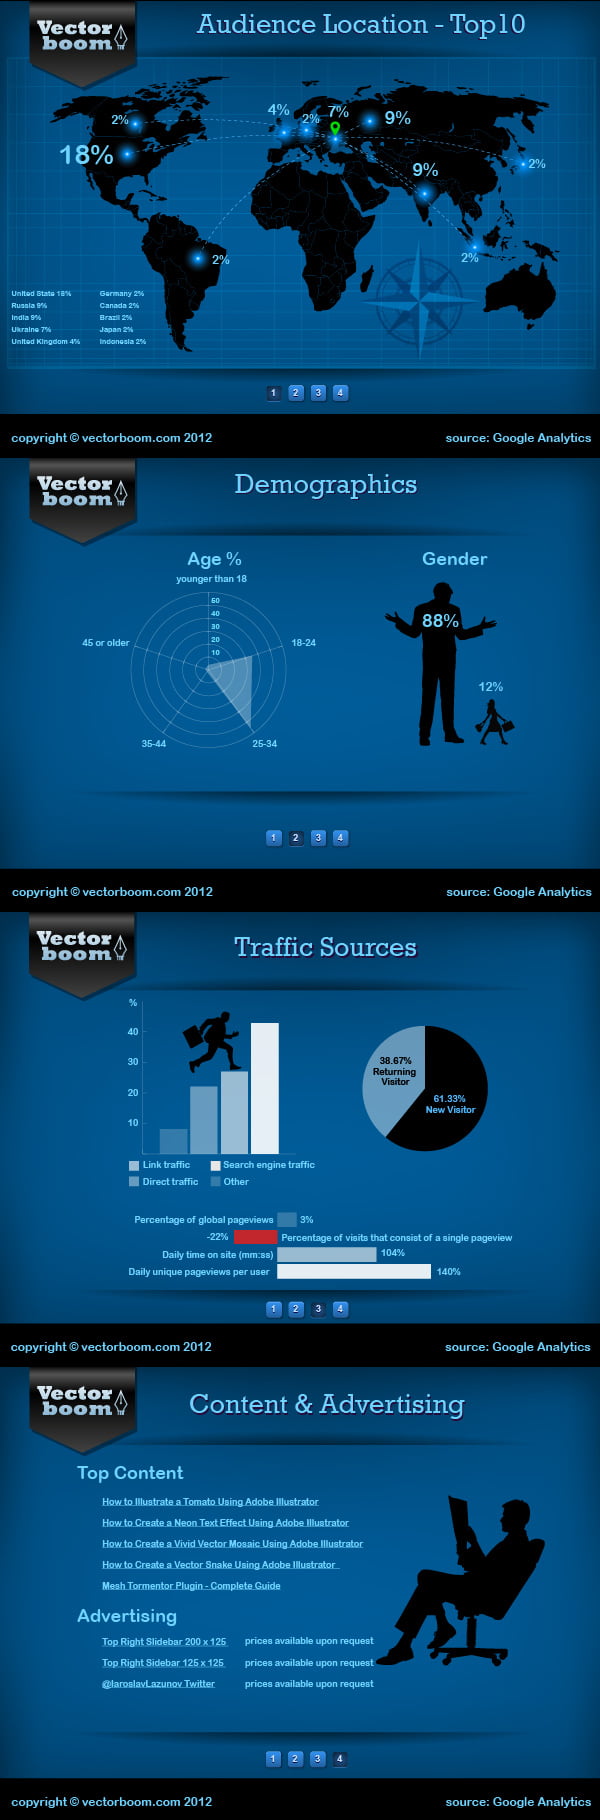
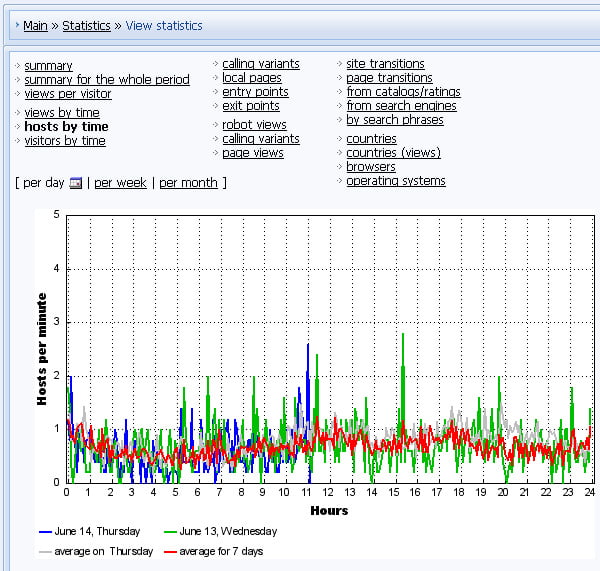
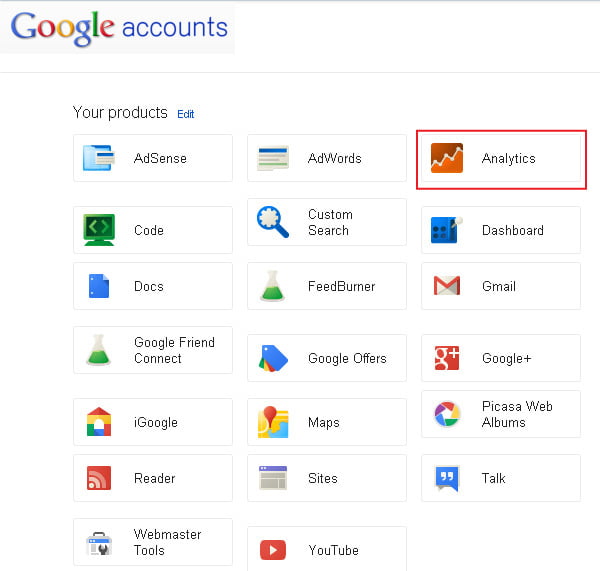
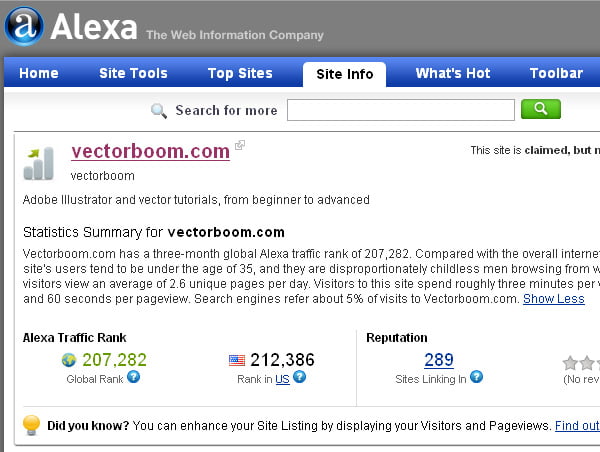
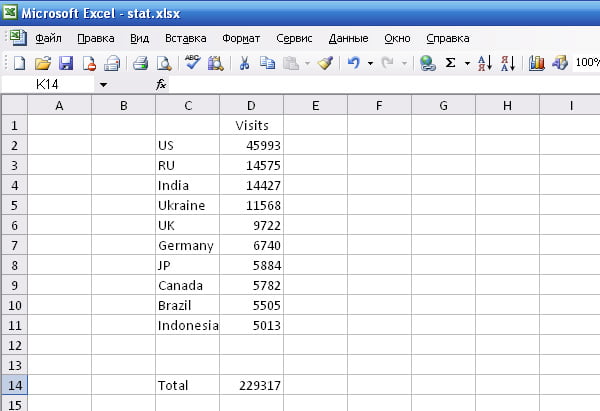
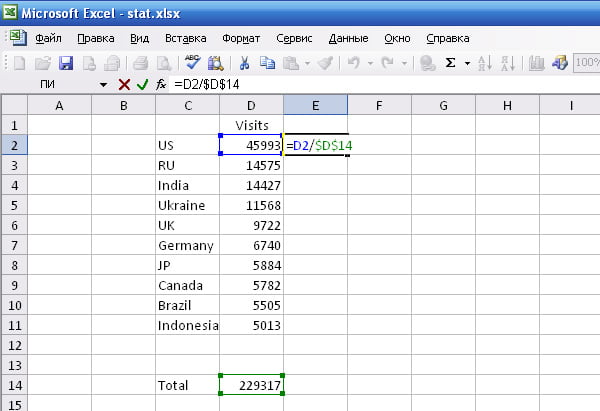
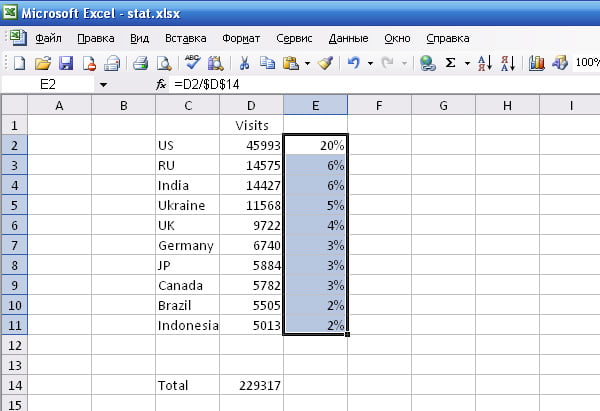
Today we are going to create website promotional infographics. Our goal is to provide exact numbers to show the dynamics of its development, demographic composition of visitors, and include references to the document that may lead to audience growth. Step 1 — Working with the Sources of DataData collection for this project should be easy. Modern content management systems (CMS) such as WordPress allow you to create websites that have statistics modules. My website was created by the UCOZ CMS, the picture below shows the statistics module in this system. In addition your website contains information that can be collected, analyzed and presented in graphical form. For example, amount of posts, amount of comments on them, the most popular publications, etc. There are also external data sources. The most popular ones of these resources, for sure, is Google Analytics and Alexa. These are the sources I will be using in this project. Step 2After data has been collected, you probably need to process it. For example, the information is presented in digital values, and you want to present it only in percentage form. You can use a spreadsheet such as Microsoft Excel for data processing.
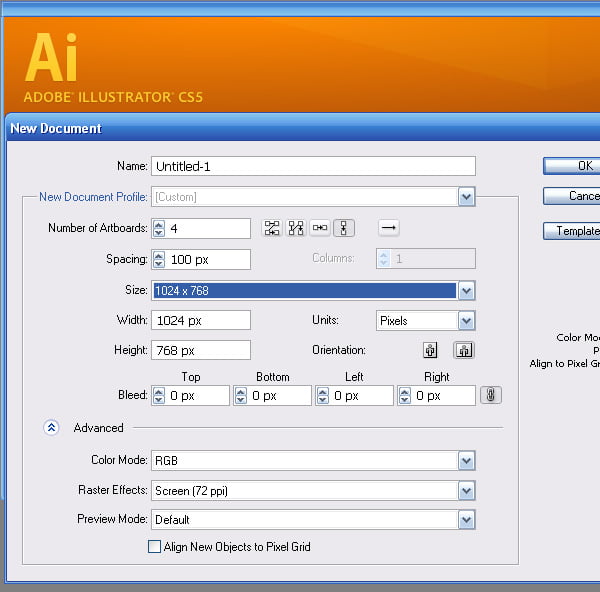
These applications allow you to use formulas for calculations and process large amount of data. So, I decided to show the following data: Audiences Location — Top 10, Demographics Age and Gender, Traffic Sources, some dynamic statistic data, as well as Top Content and Advertising information. Step 3 — The Overall DesignAfter some thinking I decided to present website infographics in the form of a multipage document. Recent releases of Adobe Illustrator allow you to create this kind of documents. Run the application and set the number of artboards and their sizes in the New Document dialog window. Multipage documents allow you to work more efficiently switching between the artboards, rather than opening multiple files. This allows you to save time and memory resources on your computer.
In addition, the document has a bunch of advantages about which you will find out in the end of this tutorial. I chose 1024 by 768 px artboard. That is the exact size of an iPad screen. Mobil Devices are very popular right now, that is why I decided to create this infographic project to be viewed on them.
You can read full version this vector tutorial on VectorTuts+
Follow us if you want to be the first to know about the latest Adobe Illustrator tutorials and articles. Vectorboom team works for you!
|